

Live GPU Profiler
Use the stat GPU command to watch per-pass GPU timings update live while you move through a level.
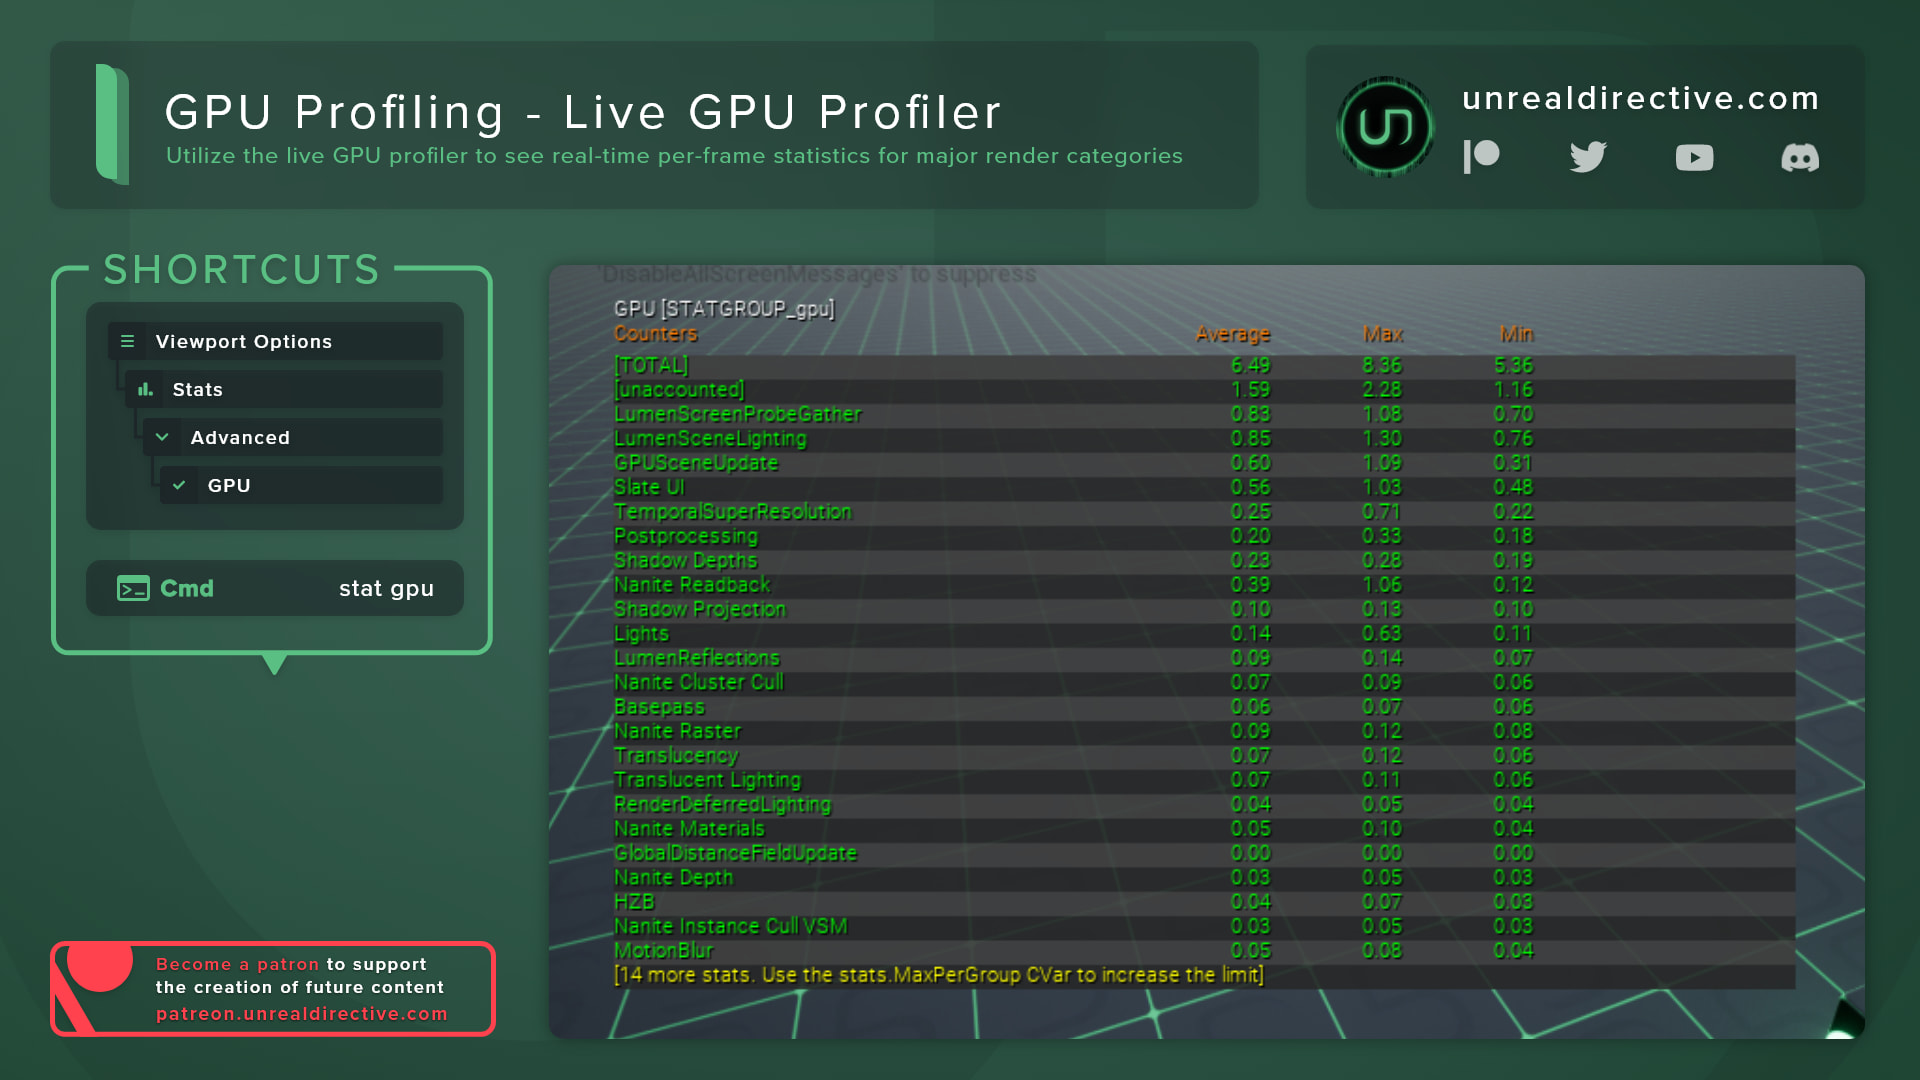
Use the live GPU profiler to see real-time, per-frame timings for the major render passes. Run the stat GPU console command to show it, and run it again to hide it.
While basic compared to ProfileGPU, it provides a quick visualization of how the GPU load shifts in an ever-changing environment, so it’s great for spotting which pass spikes as the camera moves through a specific area.
What changed in Unreal Engine 5.8?
Unreal Engine 5.8 removed the legacy GPU profiler, and stat GPU now runs on the RHI GPU profiler. The command is a shortcut that toggles every GPU timing stat group at once.
You’ll see one group per GPU queue, named like GPU 0 Graphics Queue 0 Timing. If your project uses async compute, a separate compute queue group appears alongside it. Each group lists the timed passes plus a Queue Total row for the whole queue.
Frequently asked questions
How do I know I’m GPU bound?
stat unit shows total GPU frame time next to the game and render threads. It’s ideal to check it first, before digging into individual passes.
How do I get more detail on a single frame?
Use ProfileGPU instead. It captures one frame and breaks it down in full detail.
Does stat GPU work in Shipping builds?
GPU stats are compiled out of Shipping builds, so use a Development or Test build.
Links
Check out the following resources to learn more about the subject.
Unreal Directive is free and ad-free.
If it saved you time, you can help keep it that way.