

Stat SceneRendering
Use the stat SceneRendering command to see render thread timings and scene counters in one readout.
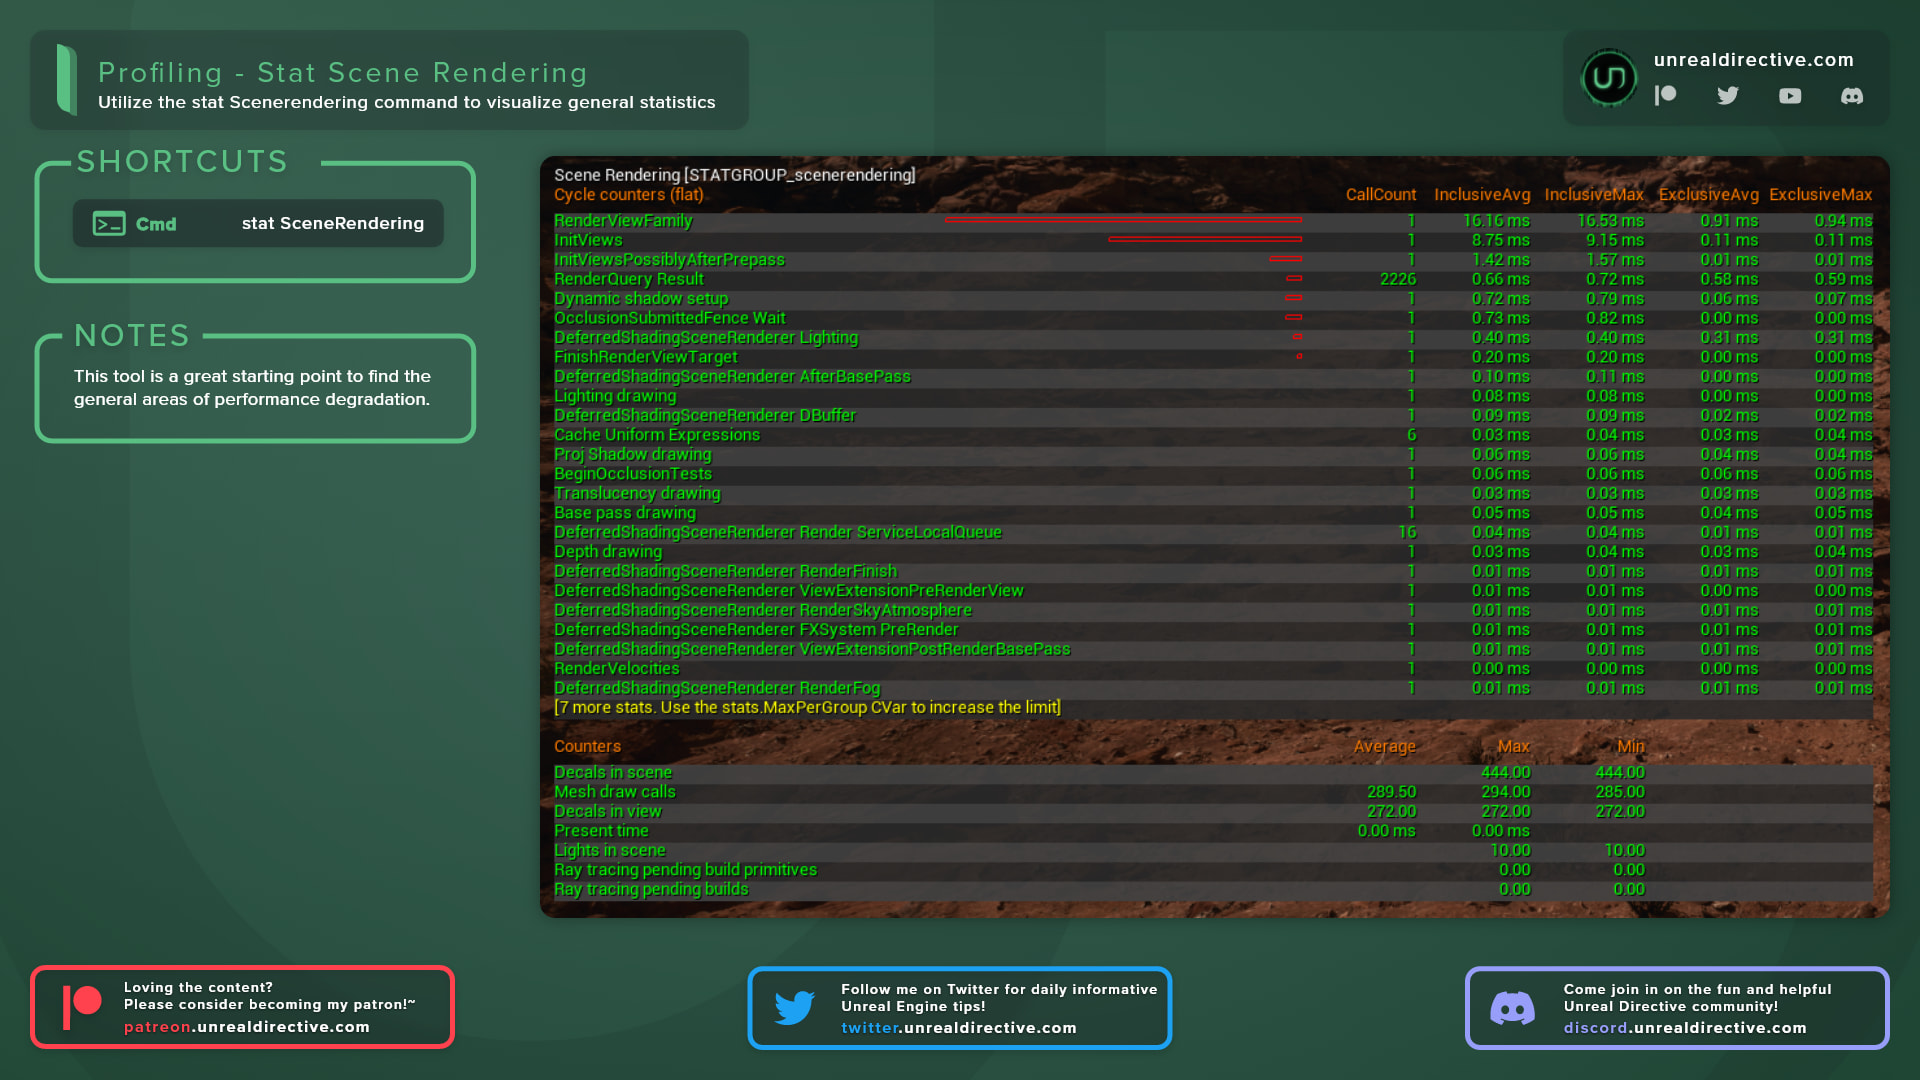
Use the stat SceneRendering console command to visualize general rendering statistics. Run it again to hide the readout.
This tool is a great starting point for finding the general areas of performance degradation. Most of its entries are render thread CPU timings, so it pairs well with stat GPU, which covers the GPU side.
What does it show?
Here are the entries you’ll see most often:
| Entry | Description |
|---|---|
| Mesh draw calls | Number of mesh draw calls submitted this frame. |
| Lights in scene | Total lights registered in the scene. |
| Decals in scene / Decals in view | Decal counts for the whole scene and the current view. |
| RenderViewFamily | Render thread time for rendering the whole view family. |
| InitViews | Time spent on visibility and view setup. |
| Base pass drawing / Depth drawing | Render thread time for submitting those passes. |
| Translucency drawing | Render thread time for submitting translucency. |
| Dynamic shadow setup | Time spent setting up dynamic shadows. |
| Present time | Time spent presenting the frame. |
The exact list depends on your scene and the features you use. For example, ray tracing adds instance counts and pipeline creation times.
Frequently asked questions
How can I dig deeper into one area?
Related stat groups focus on a single area. Try stat InitViews, stat LightRendering, and stat ShadowRendering.
Does it work in packaged builds?
Stats are compiled out of Test and Shipping builds by default, so use a Development build.
Links
Check out the following resources to learn more about the subject.
Unreal Directive is free and ad-free.
If it saved you time, you can help keep it that way.