

Stat Unit
Use the stat unit and stat unitgraph console commands to show frame, thread, and GPU timings in the viewport.
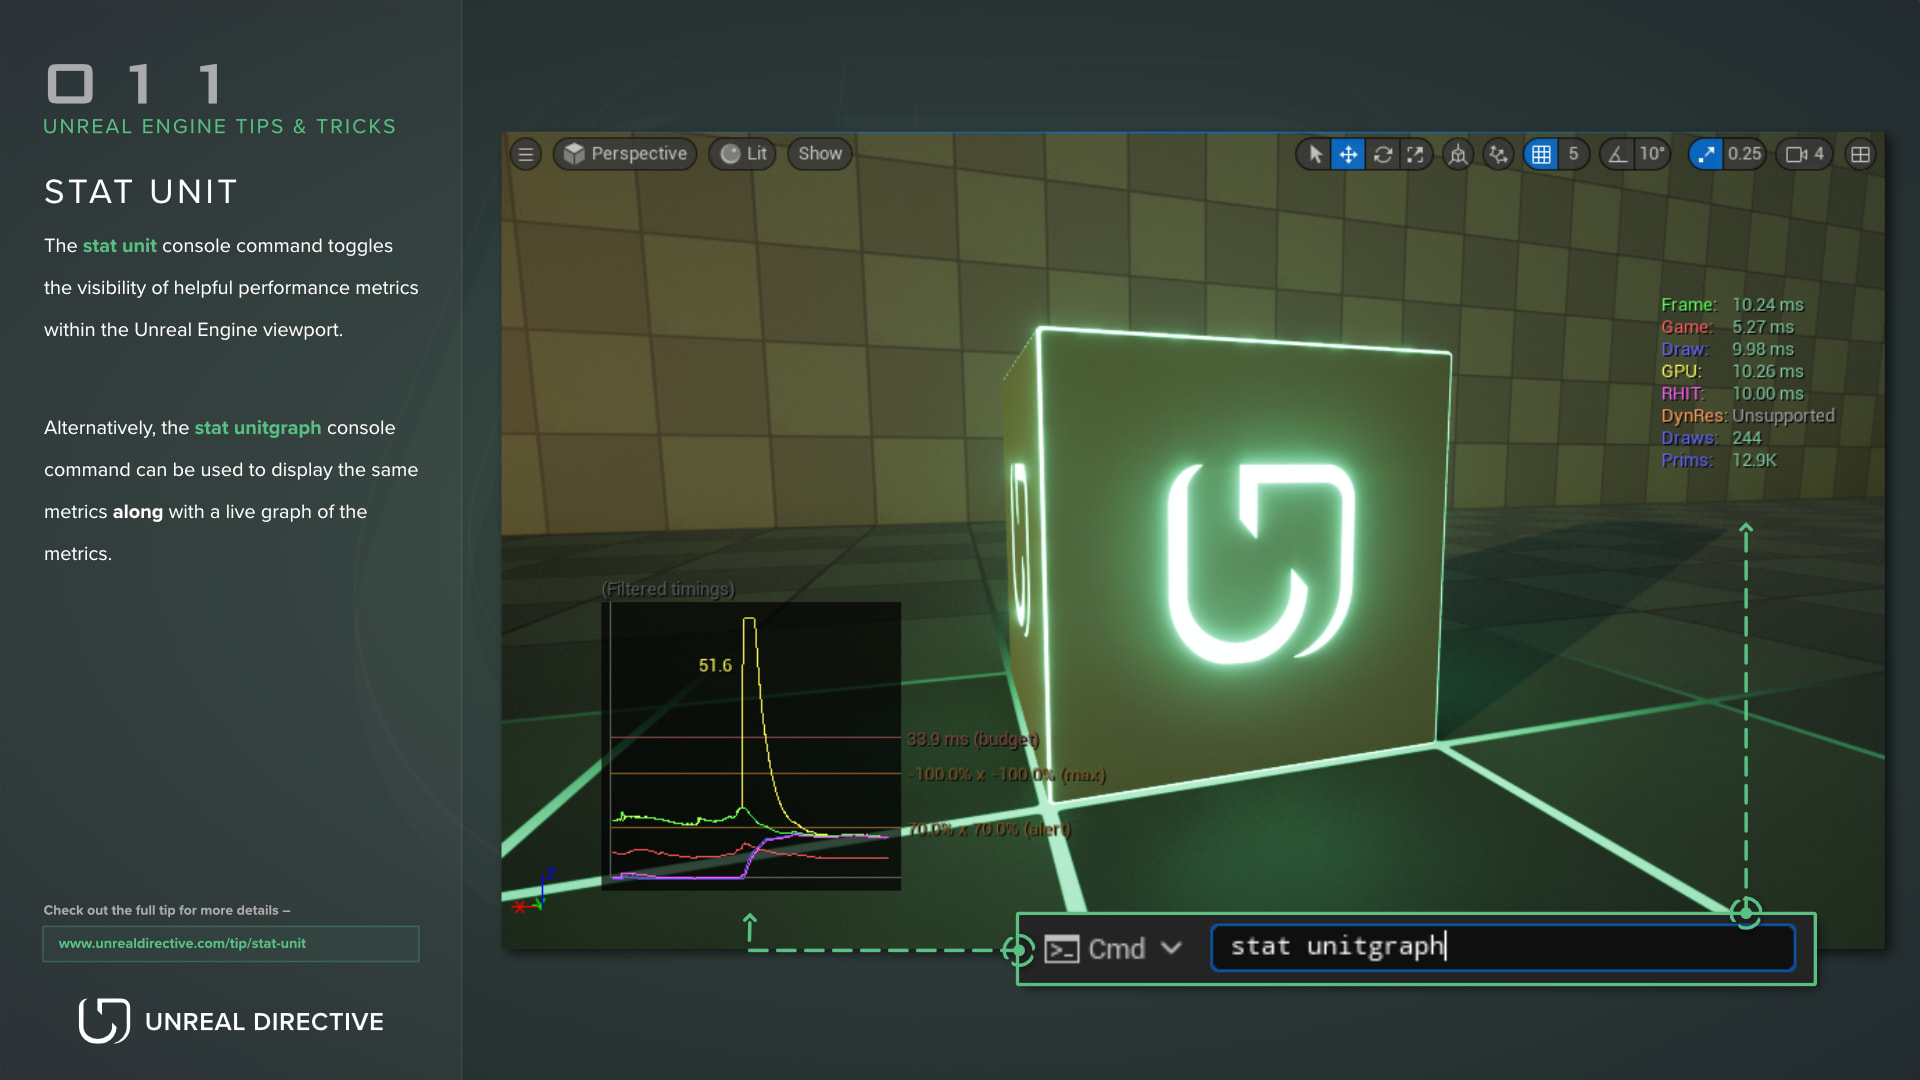
The stat unit console command toggles the visibility of helpful performance metrics within the Unreal Engine viewport, such as frame, thread, and GPU timings. Alternatively, the stat unitgraph console command can be used to display the same metrics along with a live graph of them.
What do the metrics mean?
| Metric | Description |
|---|---|
| Frame | The total time spent generating one frame of the game. |
| Game | Time spent on the game thread. If it’s close to Frame, the game’s performance is most likely bottlenecked by the game thread. |
| Draw | Time spent on the rendering thread. If it’s close to Frame, the game’s performance is most likely bottlenecked by the rendering thread. |
| RHIT | Time spent on the RHI thread, which submits work to the graphics API. Only shown when the RHI runs on its own thread. |
| GPU Time | Time the GPU spends rendering the scene. |
| Mem | Physical memory used by the process. |
| VRam | Video memory used out of the available budget. Turns red when over budget. New in Unreal Engine 5.8, desktop platforms only. |
| DynRes | The current screen percentage and render resolution, shown when dynamic resolution is enabled. Otherwise this row reads RenderRes. |
| Draws | The number of draw calls submitted. |
| Prims | The number of triangles drawn. Values above 10,000 are shown in thousands, such as 52.3K. |
Some rows only appear when they apply. On platforms that report GPU usage, extra rows show GPU Clock, GPU Usage, GPU Mem, GPUExt Usage, and GPUExt Mem, and an Input row shows input latency when the platform measures it.
Why are some values orange or red?
Timings turn green, orange, or red based on two console variables:
| Cvar | Default | Meaning |
|---|---|---|
t.TargetFrameTimeThreshold | 33.9 | Values above this many milliseconds turn orange. |
t.UnacceptableFrameTimeThreshold | 50.0 | Values above this many milliseconds turn red. |
The defaults target 30 FPS. If your project targets 60 FPS, it’s ideal to set t.TargetFrameTimeThreshold to 16.7 so the colors match your budget.
Are there similar commands?
Yes. Here are a few related ones that build on stat unit:
| Command | Description |
|---|---|
stat unitmax | Same as stat unit, plus a column of max values. |
stat unitcriticalpath | Same as stat unit, plus critical path values. |
stat raw | Shows unfiltered timings instead of smoothed averages. |
stat tsr | Same as stat unit, plus Temporal Super Resolution statistics. |
stat detailed | Turns on stat fps, stat unit, stat unitmax, stat unitgraph, and more at once. |
stats.UnitTimestamp 1 | Adds UTC time and frame number rows. New in Unreal Engine 5.8. |
Frequently asked questions
Why are the numbers so smooth?
The default timings are smoothed averages. Use stat raw to see the unfiltered values, and stat unitgraph to see spikes over time.
Do these commands work in Shipping builds?
stat unitmax, stat unitcriticalpath, stat unitgraph, stat raw, and stat tsr are only available in non-Shipping builds.
Where’s the VMem row?
With stat unitmax, Mem also shows peak usage, and a VMem row for virtual memory appears.
Links
Check out the following resources to learn more about the subject.
Unreal Directive is free and ad-free.
If it saved you time, you can help keep it that way.